How I Used AI Like an Analyst (Not a Gambler) to Build a Smarter March Madness Bracket
As a Data Professional, I approach almost all situations with an analytical approach, seeking efficiency and optimized outcomes. As I’ve been integrating AI, I’ve been finding its true value is as a force multiplier for structuring problems, testing assumptions, and accelerating analysis..
March Madness brackets turned out to be a perfect test case. Every year I fill out a number of pools, hoping to come out ahead in net, by relying on a combination of stats, intuition and instinct - I'd look at the KenPom page, scan a few injury reports, and make judgment calls based on feel. The process was slow, inconsistent, and poorly coordinated across multiple entries.
This year, I rebuilt the entire workflow using AI — from first principles to final bracket export — and treated it like a real analytical problem. I ran my process through Claude, from first principles to final export, and document what that looked like.
The Goal: From Manual to Systematic
Prior to this year, building my brackets was a time-consuming, manual process. I’d spend hours pouring through teams to understand their strengths, weaknesses, momentum & winning probabilities, mentally compiling that information to build 8+ brackets. I’d tweak winners across pools . This year, I replaced that with a structured system:
Treat entries across pools as a portfolio optimization problem
Ground every pick in quantified probabilities
Adjust picks based on pool scoring mechanics and field size
The objective wasn’t to “predict the perfect bracket.” It was to build a process that maximizes the probability of winning at least one pool.
The Methodology
The workflow followed a structured analytical pipeline:
Step 1: Building a Blended Probability Model
The fi Rather than relying on a single rating system, the approach was to build a blended model combining two sources:
Cooper ratings (Silver Bulletin): Simulation-based advancement probabilities. These were uploaded in.a spreadsheet was uploaded so Claude could work with exact numbers rather than approximations.
KenPom: Ken Pomeroy's adjusted efficiency margin system, which measures points scored and allowed per 100 possessions adjusted for opponent quality. These were converted into win probabilities via a logistic model.
Each matchup probability was a simple 50/50 blend. This matters because model disagreement is signal. If one system has a team at 70% and another at 80%, that gap represents uncertainty — and uncertainty is where differentiation opportunities emerge.
Step 2: Injury Adjustment
Model outputs are only as good as their inputs — and injuries are the fastest way for models to become stale.
I systematically incorporated updates from The Athletic, adjusting probabilities and, in some cases, capping team advancement entirely.
This step also surfaced an important limitation:
Claude initially missed several key injuries & status updates, reinforcing that AI requires curated inputs, not blind trust.
Step 3: EV Analysis Against Public Pick Rates
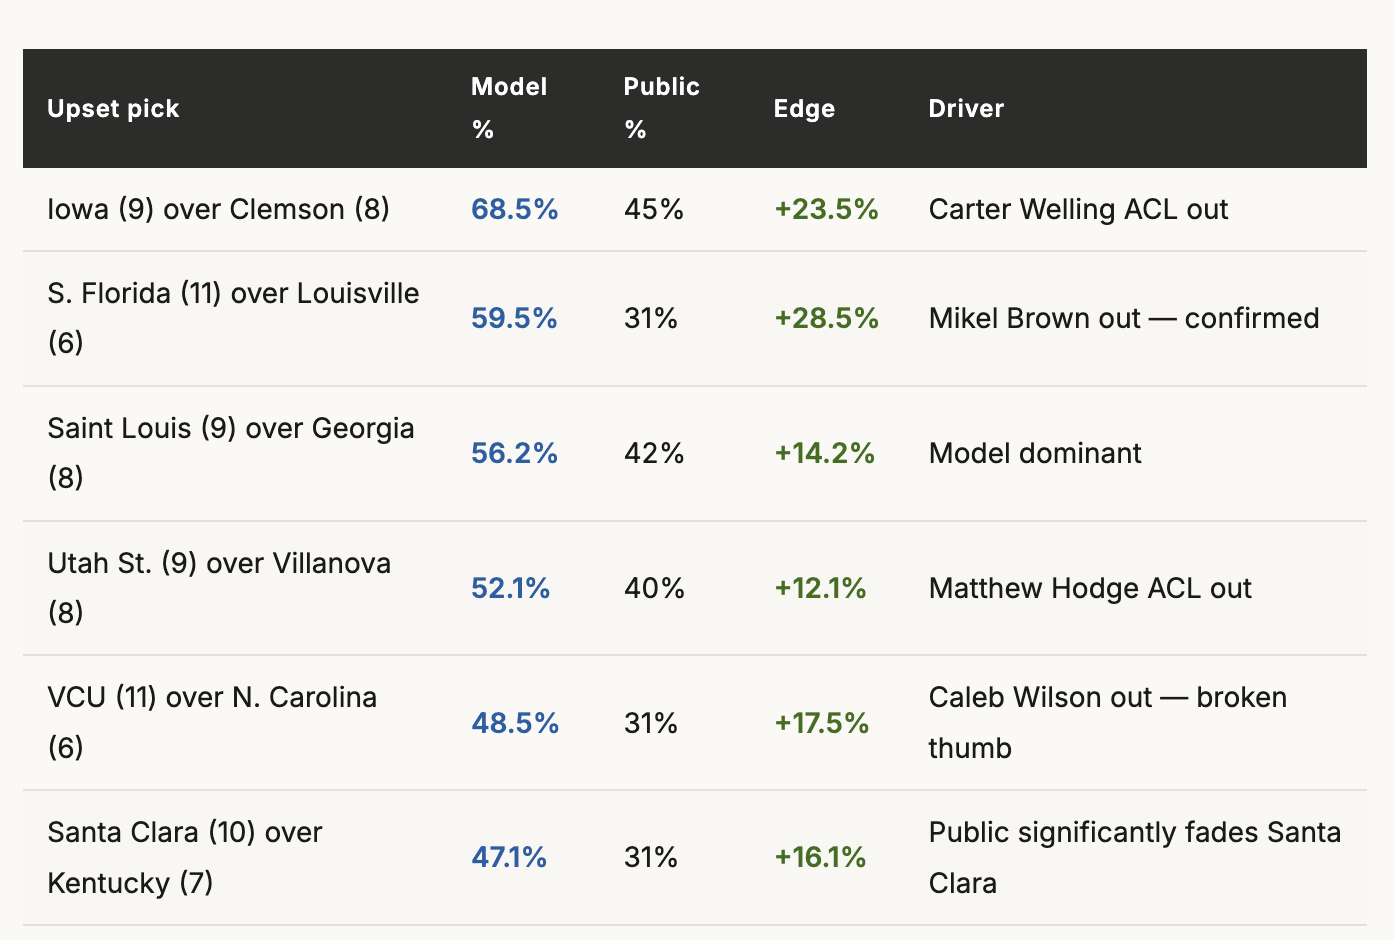
One way that I looked for an edge was by finding cases where Claude’s projections and public picks strongly diverged. For every Round 1 matchup, the blended model win probability was compared to the public pick percentage from CBS Sports and Yahoo Bracket data. The edge (model probability minus public pick rate) determined whether a pick had positive expected value against the field.
This surfaced clear opportunities — and just as importantly, eliminated false “upsets” that the public was already over-picking. Six picks cleared the bar for inclusion in all 13 entries:
The analysis also revealed picks that didn't hold up. Northern Iowa over St. John's, for example, showed a negative edge: the model had Northern Iowa at 16.4% but the public was picking them at 22%. It stayed in two entries purely for portfolio differentiation in the largest pool, but was dropped everywhere else.
Step 4: Pool-Specific Champion and Final Four Construction
With the model and injury adjustments in place, each entry's deep run picks were built according to the pool's scoring structure and size.
The seed-bonus pool demanded the most distinct treatment. Because each win scores base points plus the seed number of the winner, upsets aren't just correct calls, they're point multipliers. This pool rewarded risk, leading to "max variance" entry with nine Round 1 upsets and Vanderbilt, a 5-seed, selected at champion. This would be reckless in a standard pool — but mathematically correct in this format.
Ultimately, across the full portfolio, the 13 entries covered 8 unique champions spanning roughly 88% of the realistic championship probability space. Importantly, the brackets were differentiated and tailored to each pool’s size and rules.
Final Adjustments: Where Judgment Still Matters
After reviewing Claude’s initial pick distributions, I asked it to erun with a few intentional overrides:
Reduced UConn exposure based on qualitative concerns
Upgraded South Florida to a universal pick after injury confirmation
Both decisions, of course, were wrong. But that’s the point — the system made those decisions explicit and trackable, which is exactly how overrides should work. And Claude was nimble enough to make the changes.
What Claude Actually Did
Claude wasn’t acting as a black-box predictor. It was used as an analytical assistant. 6At a high level, I used it to:
Ingest structured data (model outputs, injury inputs)
Calculate blended probabilities and edge vs public picks
Generate bracket scenarios under defined constraints
Iterate quickly on adjustments and what-if scenarios
The outputs included:
A full bracket (round-by-round winners) for each entry
Distribution of winners across
In other words, it handled the mechanical and computational work, allowing me to focus on judgment and strategy.
What Went Wrong Along the Way
Iteration is part of any real analytical workflow. Here's what I caught and corrected mid-process, and what slipped through, which will be useful signals for refining the approach next year.
Structural Errors: It took several iterations to get correct outputs that I could use to fill out my pools. Issues included:
Incomplete Brackets: The first export only showed champion, Final Four, and a handful of noted upsets. It didn't include round-by-round picks all the way through, requiring regeneration & leading to additional errors.
Incorrect Semifinal Pairings: The first version with complete brackets reversed the semifinal matchups, East was being paired with West, and South with Midwest, requiring another round of rebuilding brackets.
Saint Louis in the Wrong Round 2 Pod: A particularly funny hallucination placed Saint Louis as the winner of Texas Tech/Alabama game in Round 2
Overlapping Columns in the PDF: Since Claude couldn’t directly import picks into my pools, it generated a pdf output that I referenced during manual pick input. The first few outputs used a two-column layout putting East/South regions side by side with West/Midwest and overlapped winners in one region's column into the adjacent region's Round 1 column..
Non-Existent Round 1 Distributions: This was the biggest problem with the output: 31 of the 32 first-round games were picked identically across all 13 entries. The only game with any variation was Akron over Texas Tech, which split 8-5. Claude applied a binary decision rule to pick the favored team across every entry. That works fine for identifying the best pick in a single bracket, but it misses the portfolio logic entirely. Across 13-entries, the goal isn't to make the same correct pick 13 times, it's to ensure that when any given game goes against the grain, at least some entries are positioned for it.
What Worked Well
Despite the issues, the process worked delivered:
Speed: I spent about ~3 hours in aggregate building/entering brackets vs the 10+ hours of manual work I previously used
Consistency: There was unified logic across all entries and a true portfolio strategy. Picks across the different entries were made to
Better decision-making: explicit probabilities and EV framing
The injury integration and seed-bonus EV modeling were particularly strong — both produced insights that wouldn’t have emerged from intuition alone.
What Could Be Done Better Next Year
The most valuable output from a first run is a clear improvement roadmap. Most of the gaps below aren't flaws in the core framework — they're places where the execution didn't fully follow through on the methodology. These are places where the framework was sound but the execution didn't follow through all the way.
Introduce controlled variance rules (e.g., split near 50/50 games) to maintain a portfolio view.
Cap team concentration at the Final Four level to hedge risk of any single team putting the entire portfolio at risk
Add automated bracket validation checks to avoid the manual review that slowed me down this year.
Track public pick movement over time, not just a single snapshot. Leverage
Backtest the portfolio against historical tournaments, to see if any approaches hold up or have structural weaknesses.
Expand inputs (recent form, matchup-specific dynamics) to strengthen the model and increase my likelihood of picking the ultimate winners
Automate final bracket entry (no manual input): it was time intensive to enter 13 brackets into the respective tools. LLMs are well designed to replace this type of work
The Takeaway
The point isn’t whether the bracket wins — March Madness is inherently random. The point is that AI enabled a fundamentally better process:
Faster iteration
Clearer assumptions
Structured decision-making
Instead of relying on intuition, I built a system that can be evaluated, improved, and reused. And saved myself time in the process!
That’s the real advantage: not prediction, but efficient process.
All probabilities reflect blended Cooper/KenPom models as of March 19, 2026, incorporating injury reports through that date. Pool details and scoring structures are as described by the respective pool administrators.